A Complete Guide: App Version Adoption and Why Visualization Matters

The presentation of data is crucial, and altering its visualization, even when utilizing identical datasets, can significantly enhance our understanding. Consider, for instance, the evolution of app version visualization throughout a recent Countly product development cycle.
Visualization: The Old Way
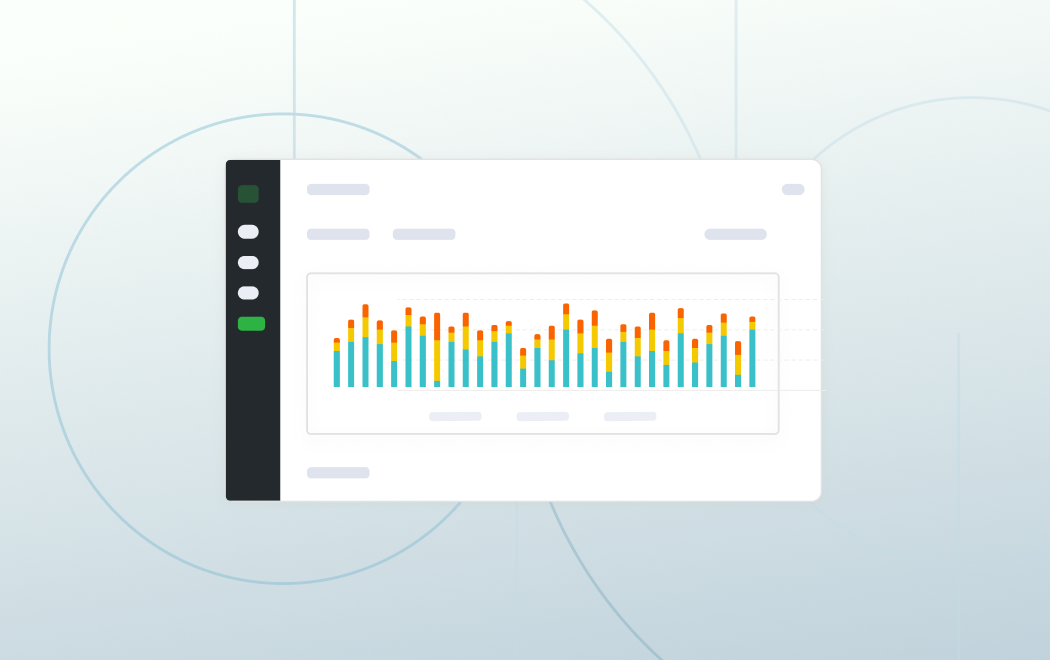
Countly collects many different data and metrics, and usually, if data is segmented, we display it in bar charts to break it down. And this is exactly the case with app versions. SDKs send the current app version with session requests, and we can collect metrics like sessions, total users/visitors, and new users/visitors for each app version. And we can break down these metrics like this.

This graph displays some metrics, like New Visitors and Total Sessions, summed up for the whole period and broken down by app version number. And the information it gives us, or basically, the questions it can answer, are either:
- Which app version had the most sessions?
- What is the amount of new visitors in each app version in the provided period?
Of course, such information can be useful, but most probably, when thinking about app versions, we want to answer a different kind of question. For example, how quickly do your users adopt the newly released app version? And we do have the data, but we cannot get it from this visualization, so let's try to change it a bit.
Visualization: The New Way
To see app version adoption, we need to break down data not only by app versions but also by dates. And the metric that would show us this the most would be the user count for each app version. Additionally, such graphs are better viewed over longer periods of time to really see the trend in app version adoptions. And we need to account for all that when designing the new visualization for it.
If we simply break down data by dates and then break down each date by app versions and display a graph over the last 60 days, we end up with too many bars for each day and each app version. Even if we use only one metric, like users, we still end up with a cluttered graph and small bars.

What we can do to improve the situation is switch to stacked bars for each day. That way, we will only display as many bars as the days we selected, and each day will be nicely broken down by the app versions existing on that day.

Now this looks much better, but the different count of users each day can still prevent us from properly perceiving how quickly our users are converting from one app version to another.
To account for that, we can normalize the data by treating all users on one single day as 100% and then break down the stacked bar by displaying each app version as the portion of that day's total user count.

This way the whole graph is evenly distributed on the y-axis, and we can clearly see when a new app version is introduced and when we finish receiving data for the old app version (or that data becomes negligibly small).
Conclusion
Data visualization is a key component of analytics, and it's essential to consider the context and the specific queries our customers are seeking to answer. Continuously adapting and refining these visualizations is central to our strategy for the Countly dashboards, with many enhancements driven by customer feedback.
If you have suggestions or feedback regarding any data visualization in Countly, we invite you to join our Discord server and share your thoughts with us: https://discord.gg/countly.


Posts that our readers love


to grow your product
is here.