Here's Why Heatmaps Need to be Part of Your Analytics Strategy


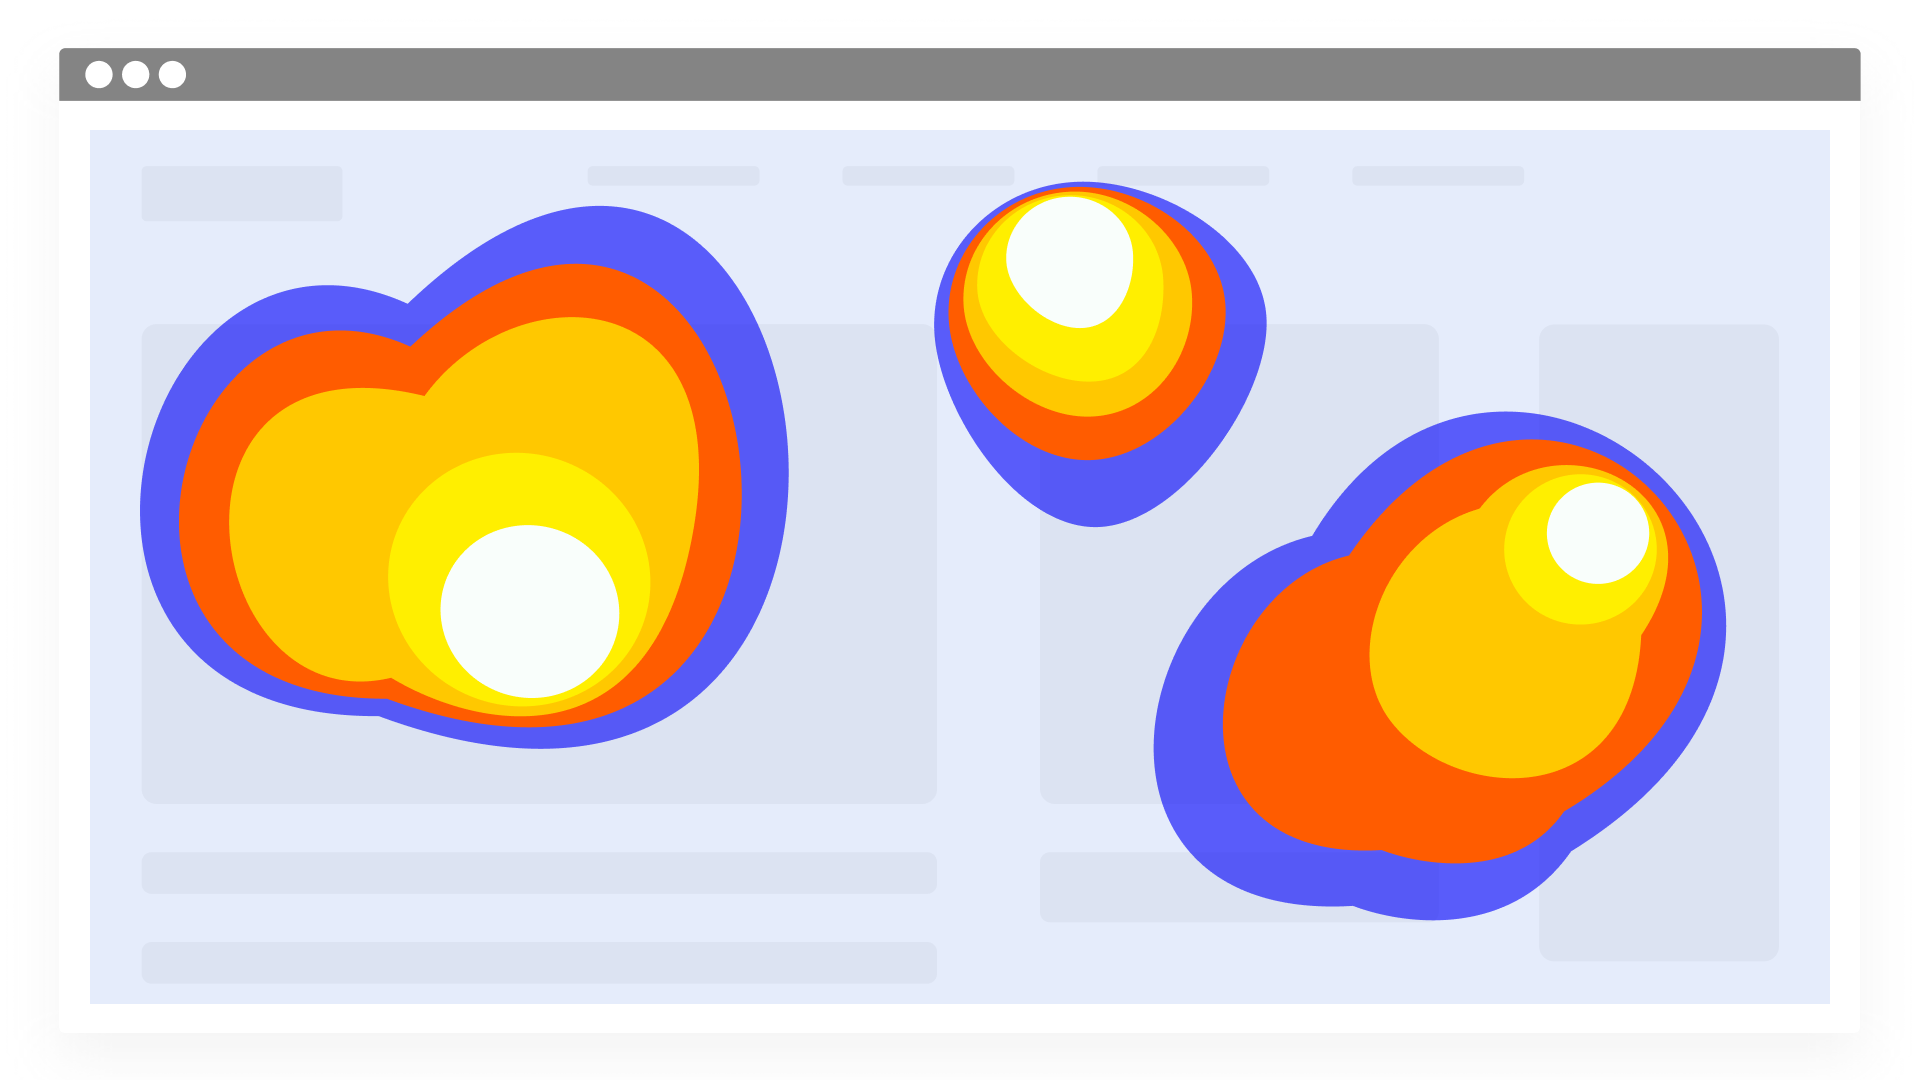
Heatmaps are a visual representation of how your customers interact with your website. They make a great tool to identify the journeys your visitors are taking on your website, and identify points of strength and weaknesses. Oftentimes, heatmaps are studied in isolation. In this article, we delve into why that might not be the best option, and why incorporating heatmaps into your website analytics strategy offers greater effectiveness and return on investment.
Heatmaps are an integral part of understanding the customer journey and experience. While the other options mentioned offer great insight, heatmaps provide a comprehensive outlook of elements, large and small, that could otherwise be missed.
A piece of content that users expect to be clickable may not be, a button that users should be clicking on to advance in their journey is being missed or overlooked, a large amount of time is being spent by most users on specific content paragraphs - these are insights that only heatmaps can provide.
To better understand this, let’s look at the two types of heatmaps that Countly offers.

Click maps provide a visual representation of visitor engagement with a webpage through the number of clicks on its various aspects. This is especially useful when you’re attempting to understand where customers desire more information (thereby identifying the next step in the intuitive customer journey) or where they are openly ignoring CTAs (thereby enabling optimization of customer journeys).

Scroll maps provide a visual representation of visitor engagement with a webpage through how much of the webpage they scrolled down to. This is especially useful when you’re attempting to identify where to place the most important content so that all visitors see it (ensuring impactful messaging) or where your visitors’ interest is being lost (thereby optimizing your website and marketing for optimal engagement).
In general, heatmaps help you measure the following:
Some of the specific actions you can undertake with click and scroll heatmaps include:
So far, we’ve seen the large impact that heatmaps can have in assessing and optimizing customer experiences and journeys. The question that arises then is: Is using heatmaps enough to achieve these business advantages?
Conversely, it might be tempting to say that heatmaps are no longer as crucial as they once were; that, with options like funnels and flows, surveys, and chatbots, heatmaps are no longer really necessary to understand the customer journey. This raises a different question: Do we even need heatmaps anymore?
The fact is that heatmaps remain as crucial now as they were before, as you may have concluded from the information above. At the same time, it is also a fact that website analytics have come a long way, and now offer a lot in addition to heatmaps.
The answer to both of the questions above then is that heatmaps are integral to understanding the customer journey, but are truly most effective when used in conjunction with other analytics features.
In Countly, for example, heatmaps can be cross-analyzed with User Profiles, Funnels, Flows, and other features to get a comprehensive understanding of your visitors, their expectations, and their preferences, thereby enabling a truly personalized customer experience.
If you’d like to see how you can apply Countly and its various website and mobile app analytics features to build better products, speak to one of our analytics experts today!