Not All “Drill-Down” Analytics Is Created Equal


Many analytics platforms claim to support deep exploration. But in practice, “drill-down” often means navigating predefined reports—not actually querying your data. That distinction becomes clear when you look at how tools like Google Analytics 4, Piwik PRO, or Dataroid approach analysis.
What “Drill-Down” Really Means
In most analytics tools, drill-down refers to clicking deeper into dashboards—filtering segments, breaking down charts, or switching views. But true analytical depth is something else entirely. It means defining your own questions, combining data points freely, and exploring behavior without being constrained by predefined structures. It’s not about navigating reports—it’s about querying data.That’s the difference between seeing what the tool shows you and asking what you actually want to know.
How Analytics Tools Approach Exploration
Different platforms take very different approaches to “drill-down.”
Google Analytics 4
Provides Explorations—custom reports that support funnels, paths, and segmentation. For many use cases, that’s enough. But as datasets grow or questions become more complex, limitations appear: sampling, retention limits, and restrictions in how dimensions can be combined. At that point, deeper analysis depends on exporting data to BigQuery and writing SQL.
Piwik PRO
Offers data control, privacy-focused tracking, and solid reporting capabilites. It supports custom reports, segmentation, and raw data access (depending on deployment and configuration). However, exploration is still largely driven by predefined reports and UI constraints. Advanced or highly specific queries may require exporting data or using external tools for deeper analysis.
Dataroid
Takes a more structured approach, offering predefined analyses like funnels, cohorts, and behavioral segmentation. These are useful, but they follow templates. There’s little flexibility to move beyond what’s already defined.All approaches work well—until your questions go beyond what was predefined.
Where the Limitations Show Up
As products scale, analytics needs change.Teams start asking questions that weren’t anticipated:
- Why did a specific cohort behave differently?
- What sequence of events led to a failure?
- How do multiple dimensions interact across sessions?
In tools like GA4, answering these questions often means:
- Running into sampling limits
- Losing visibility due to thresholding
- Exporting data into BigQuery for deeper analysis
In tools like Piwik PRO:
- Advanced analysis depends on report structure and available dimensions
- Combining complex conditions across multiple contexts can be limiting
- Deeper or edge-case analysis may require exporting data
In tools like Dataroid, the limitation is different:
- Analysis is constrained by templates
- Complex combinations aren’t always possible
- Exploration stays within predefined paths
Drill-Down Capabilities Compared
The difference between tools becomes most visible when you try to ask a question that isn’t predefined.
Why These Differences Matter
Template-based analytics tools are designed for speed and accessibility. They help teams answer common questions quickly. But as products grow, questions become less predictable.Teams need to:
- Investigate anomalies
- Combine dimensions in new ways
- Explore behavior that doesn’t fit predefined reports
When the tool can’t support that, the fallback is always the same: export the data somewhere else. That introduces friction—new systems, engineering dependency, and often a growing disconnect between analytics and the rest of the product.
What True Ad-Hoc Analytics Looks Like
Real analytical flexibility doesn’t rely on predefined paths. It means working directly with event-level data, without sampling or artificial limits. It means combining user, event, and session data freely, and exploring historical data without restrictions. Most importantly, it means asking questions without leaving the system. That’s the difference between a reporting tool and a data system.
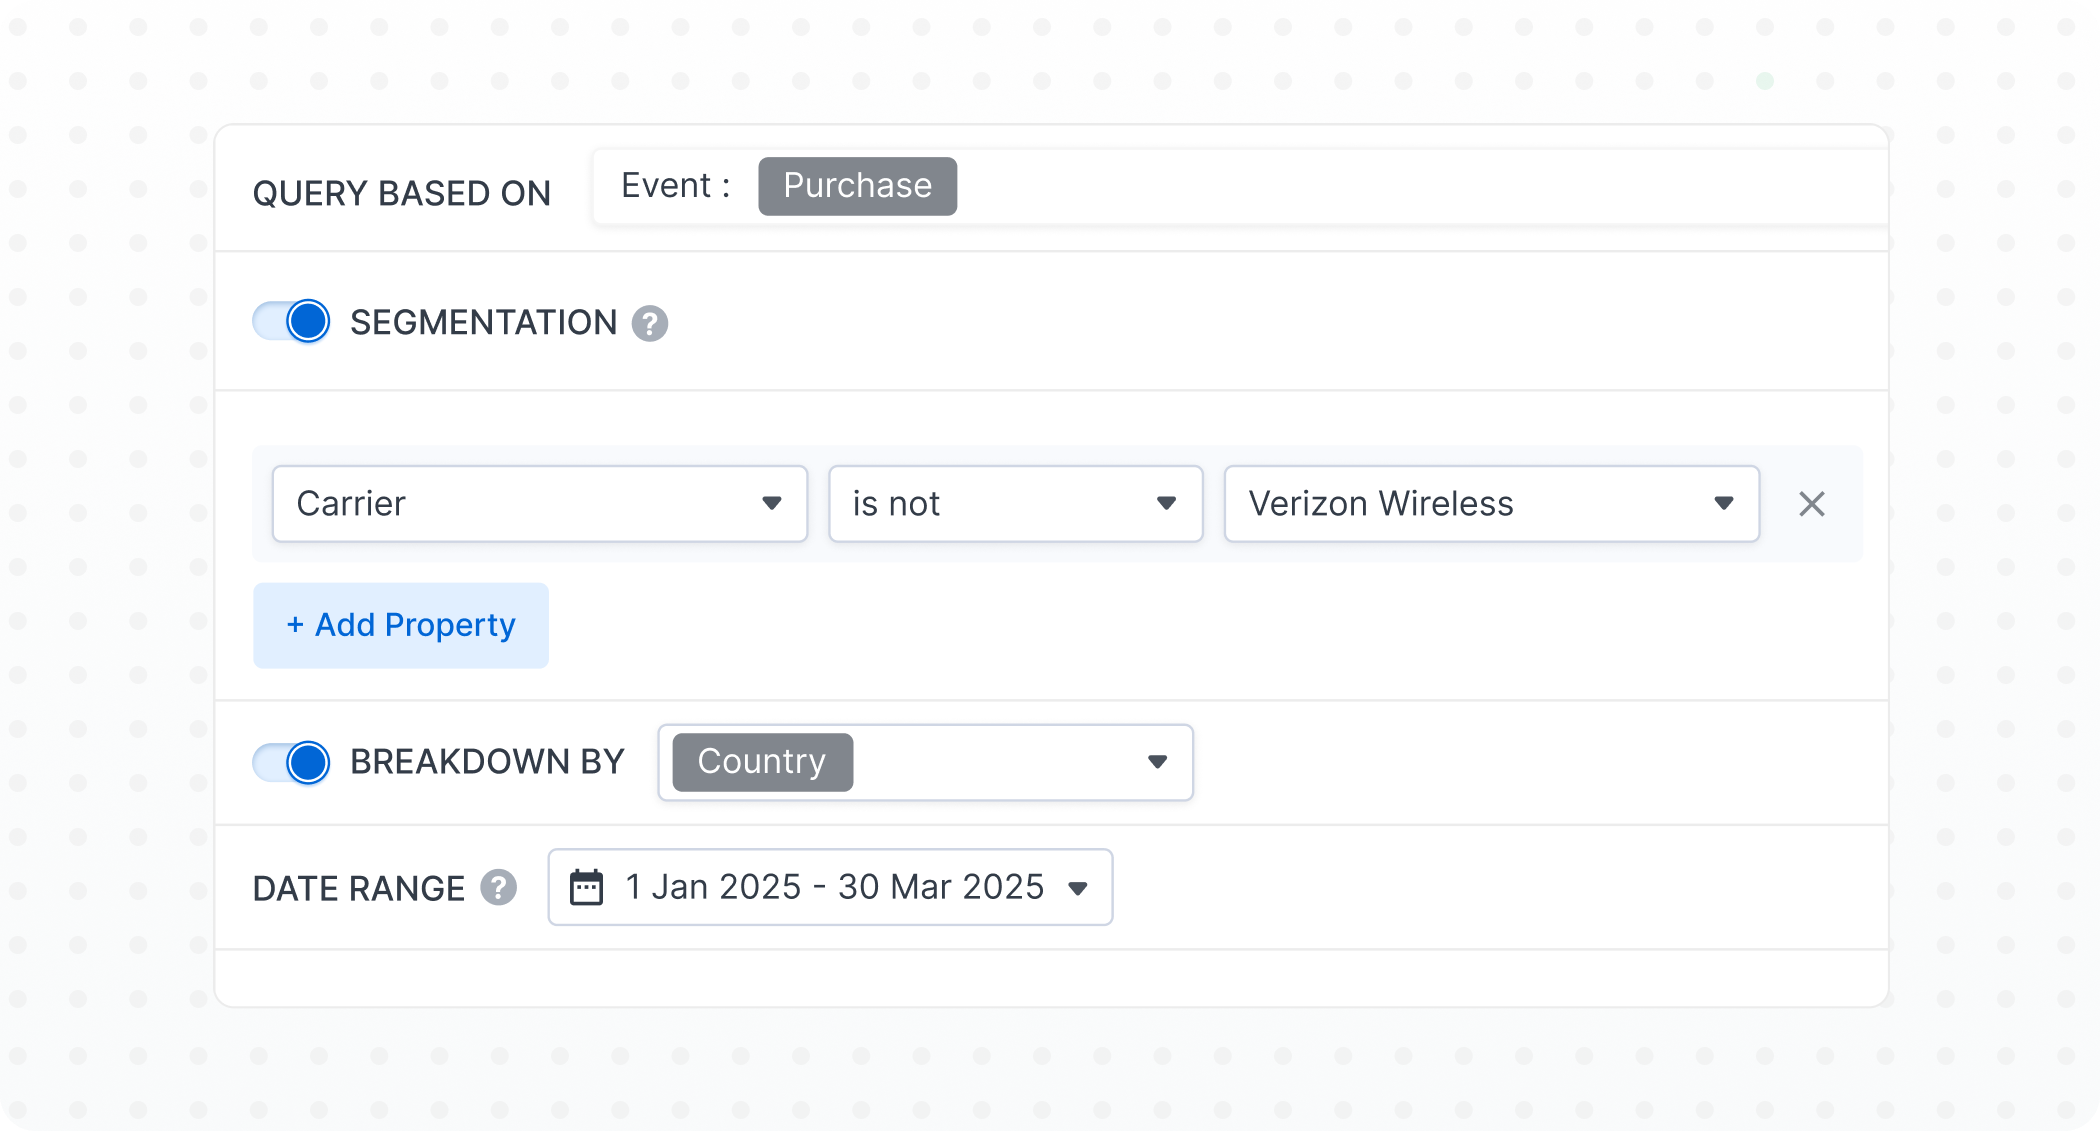
Where Countly Drill Is Different
Countly Drill is built around direct access to product data. Instead of guiding users through templates, it allows teams to define their own queries—freely combining dimensions, applying full logical conditions, and exploring behavior without constraints.There’s no sampling, no retention ceiling, and no need to move data into another system just to analyze it. Because it runs within your own infrastructure, the same data can be used across analytics, operations, and internal workflows—without leaving your environment.
The Real Divide
Most analytics tools fall into one of two categories. Some are built around templates—predefined reports, guided segmentation, and structured exploration. They prioritize simplicity, but limit flexibility. Others are built around querying data directly—giving teams full control over how data is explored, combined, and understood. The difference isn’t just in features. It’s in how much control you have over your data.For early-stage teams, template-based analytics is often enough. But as products grow:
- Data volume increases
- Edge cases become more common
- Questions become more complex
At that point, the limitation isn’t dashboards, but the (in)ability to explore.
Final Thought
“Drill-down” is often presented as a feature. In reality, it’s a capability—defined by how much freedom you have to work with your data. If answering a new question requires exporting data, writing queries elsewhere, or restructuring reports, you’re not really drilling down. You’re working around the tool.
Posts that our readers love


to grow your product
is here.